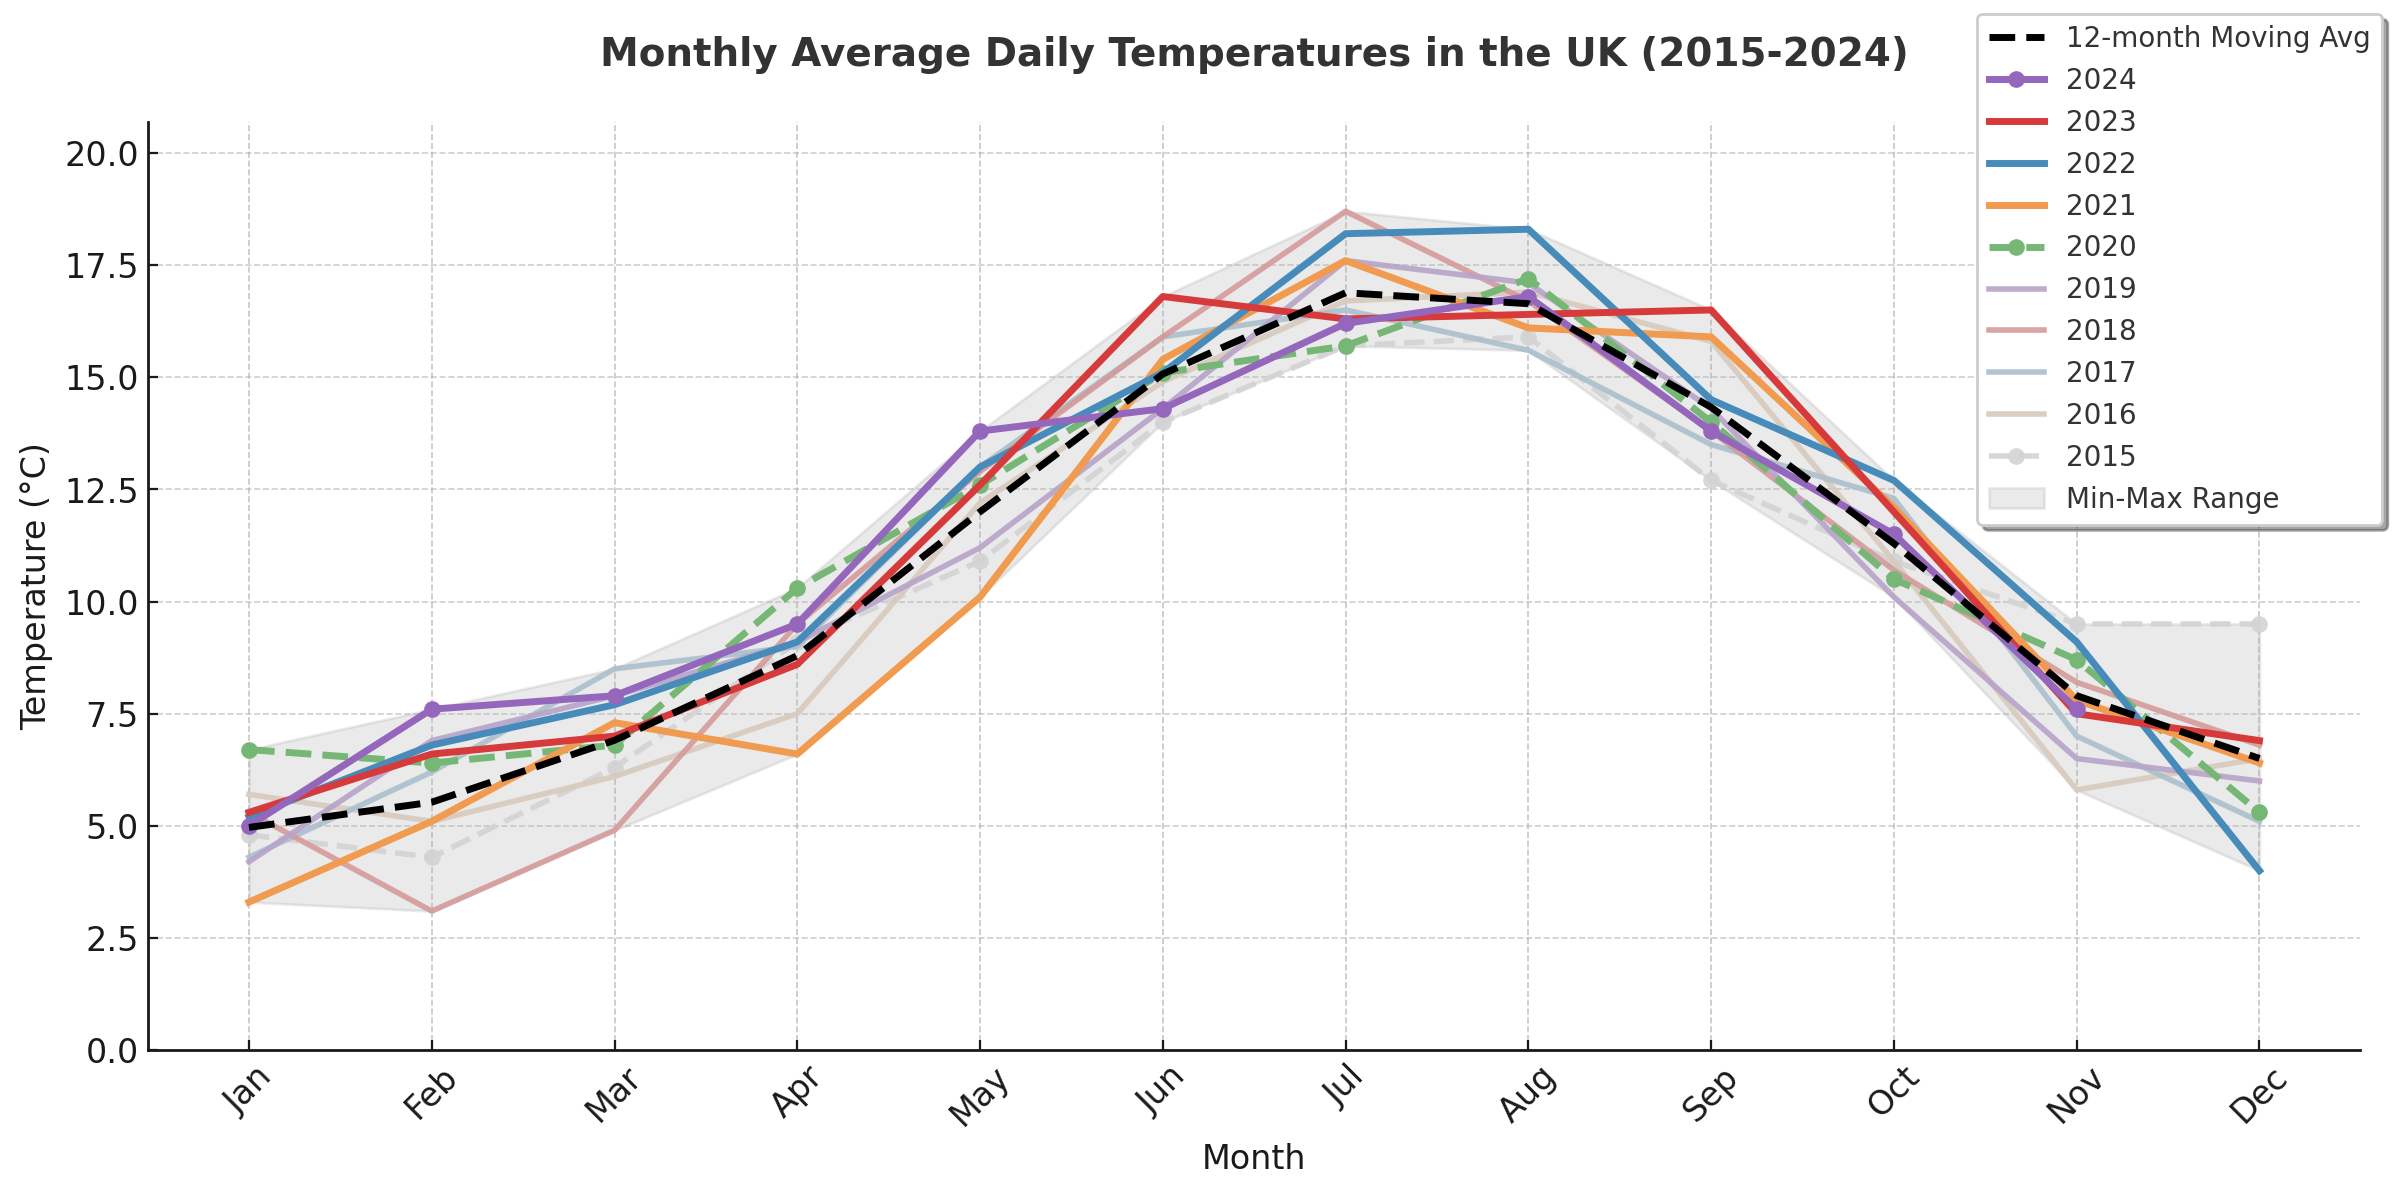
Example 1: UK Temperature Data

What - Why - How Analysis
What (Data)
The dataset represents monthly average daily temperatures in the United Kingdom (UK) from January 2015 to November 2024.
Why (Task)
The primary objective is to analyze long-term temperature trends and seasonal variations in the UK.
How (Idiom)
Line chart to effectively display trends over time
Cyclic color scale to distinguish years while maintaining consistency
Min-Max range shading to highlight variability and extreme values
Heatmap to compactly visualize seasonal patterns across multiple years
Optimized Temperature Visualization
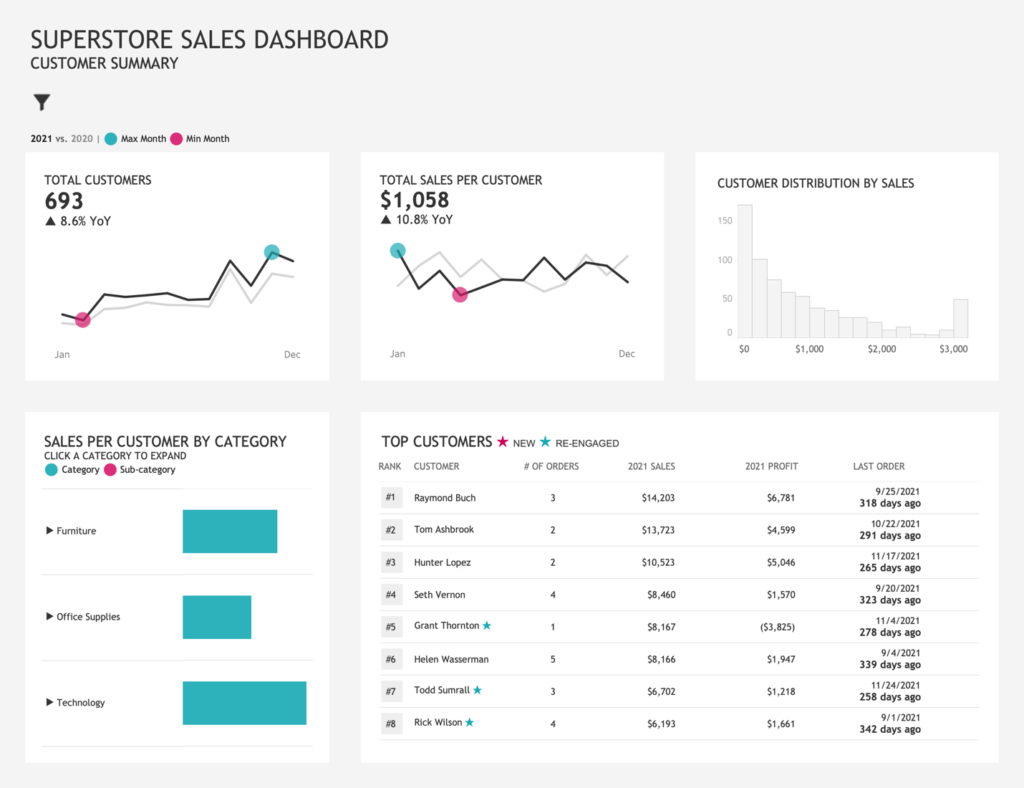
Example 2: Tableau Dashboard Design
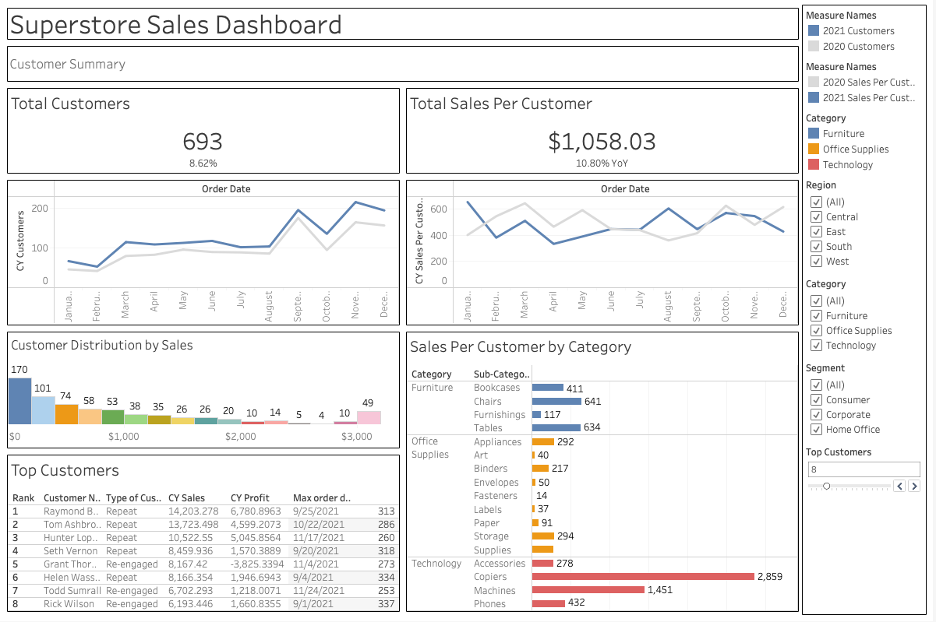
What - Why - How Analysis
What (Data)
Superstore sales data, including sales, profits, customer types, and year-over-year comparisons.
Why (Task)
Provide actionable insights for performance optimization.
How (Idiom)
Decluttered dashboard with a structured layout for better readability
Direct labeling on charts to reduce reliance on separate legends
Color-coded highlights to emphasize key insights without overwhelming the viewer
Consistent fonts, spacing, and alignment to create a professional, easy-to-read interface